
A slow SQL query is rarely just a database problem. It can delay a client dashboard, make a CRM export time out, slow an API endpoint, or turn a reporting workflow into a manual chore. The tempting response is to rewrite the SQL immediately. That is also how teams waste hours optimizing the wrong thing.
Good query optimization starts with evidence: identify the expensive query, understand why the optimizer chose its plan, make one targeted change, and prove the result under realistic load. This guide gives teams a practical method they can repeat across SQL Server, Oracle, PostgreSQL, MySQL, and cloud data platforms.
Define the performance problem before changing the query
In DBMS terms, query optimization is the process of finding an equivalent SQL statement or execution plan that returns the same correct result with less latency, CPU, memory, disk I/O, locking, or infrastructure cost. The key word is equivalent. A query is not optimized if it becomes fast by silently dropping rows, changing join logic, or returning stale data.
For growth, agency, and product teams, the symptoms are usually business-facing: a campaign dashboard takes 20 seconds to load, product search feels sluggish, a weekly report blocks a pipeline, a CRM export fails, or a customer-facing API exceeds its timeout. SQL may be responsible, but it may not be the only cause.
Before tuning, separate database time from application time. Inspect API tracing, connection-pool waits, network latency, serialization time, cache misses, and N+1 query behavior. A request that runs 100 fast queries can still be slower than one well-designed query. Likewise, a dashboard can feel slow because it requests too much data or renders a huge payload in the browser.

Capture a baseline and find the long-running queries
Do not start with a query pasted into a console by a frustrated teammate. Start with a baseline that describes the problem under real conditions. Record median latency (p50), tail latency (p95 or p99), execution count, rows read versus rows returned, CPU time, memory use, disk I/O, lock waits, and the query's relative cost within the workload.
A query that takes 800 ms once a day may deserve less attention than one that takes 120 ms but runs 50,000 times per hour. Likewise, a query returning 25 rows after reading 15 million rows is a clearer tuning target than a query returning 100,000 rows because the user explicitly requested a large export.
To find long-running queries, use the database's monitoring layer rather than relying on anecdotes. In SQL Server, Query Store and dynamic management views (DMVs) are usually the best starting points. In Oracle, performance views and runtime plan information provide the relevant evidence. PostgreSQL teams often use pg_stat_statements and slow-query logs, while MySQL teams commonly use the slow query log and Performance Schema.
Build a reproducible test case with representative parameter values, the relevant schema version, and a rollback path. A query can be fast in a developer console yet slow in production because production has different data volume, data skew, cache state, concurrent users, parameter values, statistics, indexes, or hardware pressure.
Use production-safe query capture, not ad hoc guesswork
Capture query data with sampling or a sensible duration threshold. For example, log requests that exceed 1 second for an interactive endpoint or 30 seconds for a batch report, then group them by normalized query fingerprint rather than treating every literal value as a separate problem.
Redact customer data, tokens, email addresses, and other sensitive values before sending logs outside the engineering environment. Use parameterized queries wherever possible so sensitive literals are not embedded in captured SQL.
Common mistake: running a broad diagnostic query or collecting an actual plan for an unbounded report during peak traffic. Diagnostics consume resources too. Prefer lightweight monitoring first, test intrusive analysis in a replica or staging environment where possible, and schedule deeper investigation away from the busiest window.
Read the execution plan to locate the real bottleneck
The execution plan shows how the database intends to retrieve, join, sort, and aggregate data. The optimizer evaluates possible approaches using table statistics and a cost model, then chooses a plan it estimates to be cheapest. This plan-selection process is at the heart of query optimization techniques.
Use an actual execution plan when it is safe and available. Estimated plans are useful, but they can hide the most important problem: the optimizer expected 100 rows and actually processed 5 million. That cardinality error can lead to an inappropriate join type, inadequate memory grant, a spill to disk, or an inefficient access path.
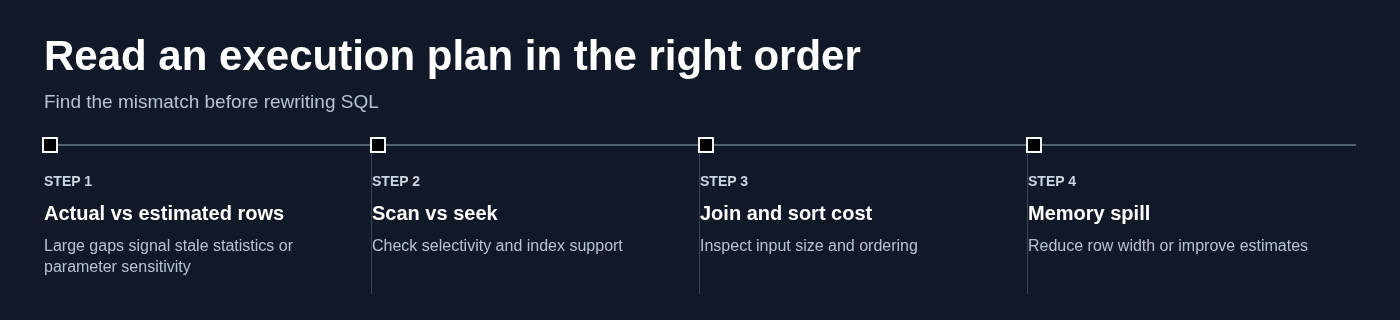
Read the plan in a deliberate order:
- Compare estimated rows with actual rows and find the largest discrepancies.
- Identify the operators responsible for the most elapsed time, reads, CPU, or memory.
- Trace upstream to determine why too many rows entered that operator.
- Inspect scans, joins, sorts, key lookups, spills, and parallelism in the context of actual row counts.
A scan is not automatically bad. Reading most of a small table, or most of a very large table for a legitimate full report, can be cheaper than many index lookups. The important question is whether the access path matches the query's selectivity and workload.
Reduce the amount of data the database must read, join, and sort
The most reliable way to reduce SQL query execution time is to reduce unnecessary work. Filter early, return only required columns, avoid sorting rows nobody will see, and avoid building huge intermediate result sets only to discard most of them later.
Start with the simple checks. Replace SELECT * with a specific projection when wide columns such as JSON, HTML, text, or blobs are not needed. Remove an unnecessary DISTINCT instead of using it to conceal a duplicate-producing join. Remove an ORDER BY from a query where output order has no business purpose.
To get the first 100 rows, use a deterministic order and the syntax your database supports. SQL Server commonly uses TOP (100); PostgreSQL and MySQL use LIMIT 100; Oracle supports FETCH FIRST 100 ROWS ONLY. In every case, pair it with an explicit ORDER BY.
For example, a stable newest-first page should use a tie-breaker:
ORDER BY created_at DESC, id DESC
Without ordering, "first" has no durable meaning. The database can return rows in a different sequence after an index change, plan change, concurrent write, or restart.
The same rule applies when getting the top 1,000 rows in SQL: use TOP (1000), LIMIT 1000, or FETCH FIRST 1000 ROWS ONLY, with a meaningful order. If a user asks to select 10,000 rows, first confirm that they need all 10,000 at once. For interactive applications, keyset pagination is often better than a huge result set or deep offset pagination.
For example, instead of repeatedly using a growing offset, request the next page after the last seen key:
WHERE (created_at, id) < (:last_created_at, :last_id) ORDER BY created_at DESC, id DESC LIMIT 100
Use database-appropriate syntax for composite comparisons. The principle is what matters: seek from a known position rather than forcing the server to count and discard thousands of earlier rows.
Rewrite non-sargable filters so indexes can be used
A predicate is often called sargable when the database can use an index to search for the relevant values efficiently. Applying a function, cast, or calculation to an indexed column can prevent that.
For example, this pattern can make an index on created_at much less useful:
WHERE DATE(created_at) = '2026-08-21'
A range predicate is generally better:
WHERE created_at >= '2026-08-21' AND created_at < '2026-08-22'
Other common offenders include implicit type conversions, leading-wildcard searches such as LIKE '%trial', and broad OR conditions across unrelated columns. A function-based or expression index may help where supported, but first ask whether the predicate can be expressed in a way that uses the existing access path.
Do not assume a syntactic rewrite is faster. Validate identical results, inspect the new plan, and compare reads and duration with representative parameters.
Design indexes around the query's access path
Indexes speed up reads only when they support how a query filters, joins, orders, and projects data. An index is not a decorative performance feature; it is a physical structure with write, storage, maintenance, and planning costs.
For a composite index, a useful default is to place equality filters first, then range filters, then columns needed for ordering or joining when that layout supports the real query pattern. A reporting query filtered by account_id and date, then ordered by date, may benefit from an index beginning with (account_id, created_at). The correct design still depends on selectivity, query variants, and the database engine.
Use covering columns or included columns where supported when a query repeatedly needs a few extra fields and the database would otherwise perform many key lookups. Consider partial or filtered indexes for highly selective, stable subsets, such as active records. Expression indexes can help when a normalized expression is genuinely part of the access path.
Clustered and primary indexes define the table's principal physical or logical organization depending on the engine. Secondary indexes provide additional lookup paths. Neither is automatically sufficient for every report, API endpoint, or export.
Indexing every column will not speed up SQL Server, Oracle, PostgreSQL, or MySQL. It can make inserts and updates slower, consume storage, increase statistics maintenance, and give the optimizer more poor choices. Redundant indexes are especially expensive on write-heavy event, audit, and ingestion tables.
Validate index changes with realistic parameters and workload impact
Before deploying an index, compare logical reads, elapsed duration, CPU, returned rows, and plan shape before and after the change. Then assess the cost on writes. An index that makes a monthly report faster may be a bad trade if it materially slows high-volume lead ingestion all day.
Check for an existing index with the same leading key columns before adding another one. Missing-index suggestions in SQL Server are useful leads, not prescriptions; they do not fully account for existing indexes, write overhead, or the entire workload.
Fix joins, aggregations, and subqueries that multiply work
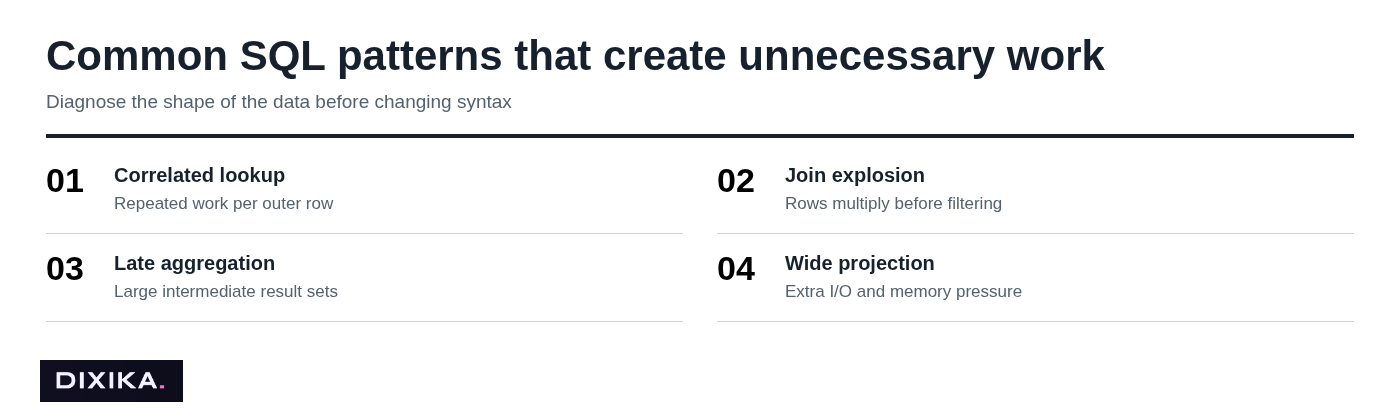
Many slow queries are structurally expensive, not merely missing an index. The biggest warning sign is a query that multiplies rows early and filters or aggregates them later.
A many-to-many join can turn thousands of input rows into millions of intermediate rows. A duplicate-producing join may then be hidden by DISTINCT, which adds a costly sort or hash operation without fixing the underlying data shape. Correlated subqueries can also repeat work once for every outer row.
Use EXISTS when the business requirement is to test whether a related record exists, not to retrieve and multiply related rows. For example, if the goal is "show accounts with at least one paid invoice," an existence check is often more appropriate than joining every invoice and applying DISTINCT.
Pre-aggregate when the final output only needs summarized data. If a dashboard needs monthly revenue by account, aggregate invoice data to the required grain before joining it to wider account dimensions. For repeatedly accessed, expensive summaries, a materialized view or maintained summary table may be justified.
Consider this query optimization example. A client dashboard lists 50 active accounts and total paid revenue for the past year. The original query joined accounts, invoices, invoice lines, contacts, and campaign events before grouping by account. It returned 50 rows but processed millions because each account's invoices were multiplied by contacts and events.
The fix was not an arbitrary index. First, revenue was aggregated from invoices and invoice lines at the account level in a separate subquery. Contact and event existence checks became EXISTS predicates rather than joins. The final query joined small, already-aggregated result sets to accounts.
After verifying identical totals for representative account sets, the actual plan showed a large reduction in intermediate rows and no spill during aggregation. The team then measured lower logical reads and a materially faster p95 dashboard response in production. The result came from correcting row shape, not from cosmetic SQL formatting.
Refresh statistics and manage plan instability
Statistics tell the optimizer how data is distributed. When they are stale, too coarse, or unrepresentative of skewed data, cardinality estimates become unreliable. A query filtering a rare campaign ID may need a very different plan from the same query filtering a common account ID.
Refresh statistics according to your database's operational guidance, especially after large imports, deletes, backfills, or substantial changes in data distribution. Histograms are particularly important when values are unevenly distributed rather than uniform.
Parameter sniffing, also called parameter sensitivity in some contexts, occurs when a plan compiled for one parameter value is reused for a very different value. Recompilation can help in specific cases, but it adds CPU and compilation overhead. Plan forcing can contain a known regression, but it should be monitored because the forced plan may become wrong as the workload evolves.
Optimizer hints have a narrow role. Use a hint to test a specific hypothesis or temporarily mitigate a proven issue. Do not use hints as a substitute for correct statistics, indexing, query structure, and capacity planning.
Use database-specific tactics without losing the core method
The workflow remains the same across platforms: measure, inspect runtime evidence, make one targeted change, verify correctness, benchmark, and monitor. The commands and diagnostics differ.
For SQL Server query optimization, start with Query Store to identify regressions and high-resource query patterns. Capture actual execution plans when safe, inspect wait statistics, and treat missing-index suggestions as investigation leads. Use TOP for limited result sets, or OFFSET ... FETCH for ordered pagination when it fits the workload.
For Oracle query optimization, distinguish EXPLAIN PLAN from runtime evidence. Runtime plans and tools such as DBMS_XPLAN are more useful for understanding what actually occurred. Use bind variables appropriately, maintain statistics, and use FETCH FIRST for row limits on supported versions. Oracle documentation and observed runtime plans should take priority over generic cross-database advice.
PostgreSQL teams should inspect EXPLAIN ANALYZE carefully, including actual rows, buffer activity, and timing. MySQL teams should review EXPLAIN ANALYZE where available, slow query log patterns, and index behavior. Cloud warehouses add another dimension: partition pruning, clustering, data scanned, and warehouse sizing often matter as much as traditional row-store indexing.
Avoid changes that usually fail to improve SQL performance
Some common actions feel productive but rarely solve the real problem:
- Replacing
SELECT *without reducing rows, large columns, or downstream work. - Adding indexes indiscriminately to every filtered column.
- Reformatting SQL or changing aliases without changing data access.
- Denormalizing tables before proving joins or schema design are the bottleneck.
- Applying blanket optimizer hints.
- Caching a bad query forever instead of fixing the access pattern.
Modern optimizers often normalize equivalent SQL expressions, so superficial rewrites may produce the same plan. Material performance changes usually come from less data read, better estimates, a better index, less row multiplication, or a more suitable physical design.
Stop tuning the query and broaden the investigation when plan evidence shows the SQL is already efficient relative to the work requested. Check schema design, storage latency, network transfer, application N+1 behavior, blocking and concurrency, connection pools, and database capacity. If the business request truly requires scanning billions of rows in real time, the solution may be pre-aggregation, partitioning, a new data model, or a different product requirement.
Use AI query optimization as an assistant, not an authority
AI can optimize SQL queries in a limited, useful sense. It can explain an execution plan, identify likely anti-patterns, suggest a rewrite, generate test cases, or propose questions to investigate. It cannot reliably infer production semantics, data distributions, security restrictions, concurrent workload, or the consequences of a proposed change from SQL text alone.
Use a guarded workflow. Redact sensitive data, provide the schema and relevant indexes, include actual-plan facts and baseline metrics, and ask for hypotheses rather than a blindly accepted "optimized" query. Test result equivalence, benchmark representative parameters, and review permissions, tenant isolation, and injection risks before deployment.
Do not confuse AI-assisted query review with mathematical optimization methods such as Bayesian optimization, convex optimization, stochastic optimization, linear optimization, or numerical optimization. Those are distinct methods used for defined optimization problems; they are not shortcuts around database diagnosis.
Build a repeatable query optimization review loop
A repeatable review loop prevents tuning from becoming a collection of heroic, undocumented fixes:
- Capture a baseline for the query fingerprint and business path.
- Isolate the dominant bottleneck using runtime metrics and the actual plan.
- Form one testable hypothesis.
- Change one variable: query shape, index, statistics, or configuration.
- Verify result correctness against the prior version.
- Benchmark representative and edge-case parameters.
- Deploy with a rollback plan and monitor for regression.
Record the query fingerprint, owner, affected product path, baseline metrics, plan evidence, change made, observed result, and rollback note. For agencies managing several client environments, this turns database work into an auditable impact report rather than an invisible engineering task.
SQL query maximum length is vendor- and client-specific, with limits imposed by the database engine, drivers, tools, and application layers. In practice, query text length is rarely the performance constraint. Parameterization, readability, maintainability, plan quality, and execution cost matter far more than approaching a theoretical character limit.
Make query optimization a measurable growth-engineering habit
Durable SQL performance gains do not come from a generic index checklist or a one-time rewrite. They come from an evidence-led loop: identify the expensive work, understand why it happens, change the smallest relevant factor, and measure the business result.
For teams connecting technical systems, reporting performance, search visibility, and growth operations, Dixika can help build the broader technical foundation behind measurable organic growth. Get in touch to discuss your needs.